
To most people, it’s clear that the world is becoming a more complicated and chaotic place. While understanding what drove recent market movements and forecasting economic and financial conditions is challenging, even during periods of relative stability, the current uncertainty complicates this problem further. This poses distinct problems for financial and treasury professionals looking to insulate their organisations from risk and optimise debt, investment, and capital strategies accordingly.
One area in which uncertainty has led to elevated volatility is the gilt market. As the gilt curve reflects the aggregate expectations of market participants about interest rates, inflation, and growth across the UK economy, as well as more international forces like global capital flows and risk sentiment, it serves as a focal point where financial anxieties are expressed. On any given day, material swings in gilt yields could be explained by the Iran War, resurgent fears about fiscal sustainability, concerns surrounding AI and the effects of large AI-driven debt issuance on government bonds, political instability, and quantitative tightening, among others.
In such a multivariate economic landscape, how do economic agents inform their expectations about where borrowing costs are going? No market participant can independently weight every piece of incoming information, let alone the systemic relationships between them. What many can do, however, is offload that cognitive load onto a narrative, or handful of narratives, through which new information is interpreted and assigned significance. Among the narratives currently contending to explain the gilt market, perhaps the most explanatory is the uncertainty surrounding the Iran War.
So, to what extent do energy prices, specifically UK natural gas, explain changes in the gilt market, and how useful is it for us to read the market through this lens?
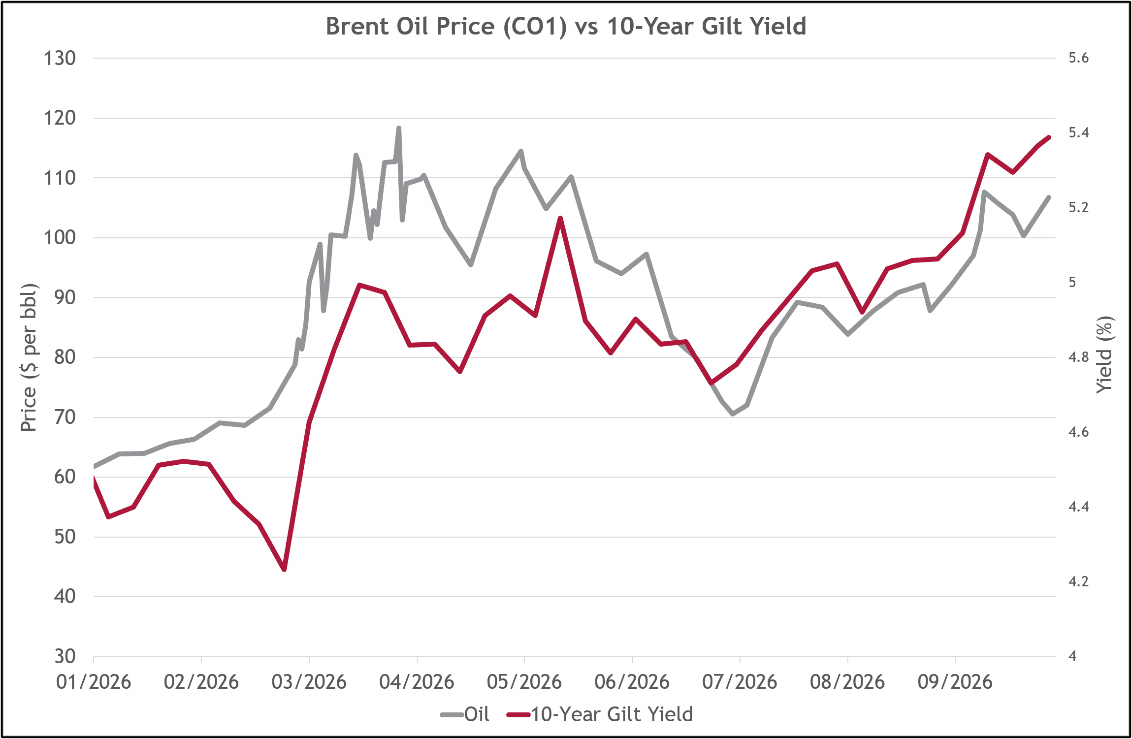
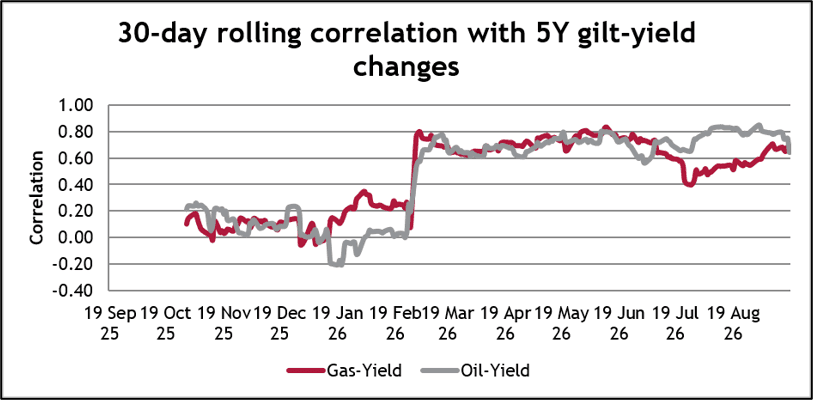
Looking at the data over the past year shown in the figure above, it looks like energy is, to a considerable extent, correlated with gilt yields, and increasingly so. A correlation measures how closely two series move together, from −1 (opposite directions) to 1 (a perfectly linear relationship). Two series that both rise over time can look linked when they are not, so we compare their day-to-day changes rather than their levels. On that basis, the correlation remains substantial, at around 0.55 for UK natural gas and 0.63 for Brent crude, and strengthens over longer periods, reaching 0.71 and 0.86 for natural gas when measured on weekly and monthly changes, respectively. Together, these two prices account for close to half of the variation in the five-year yield (its R²), and this relationship, as you can see in the figure below, which tracks it over rolling 30-day windows, was barely perceptible before the February escalation and became significant thereafter.
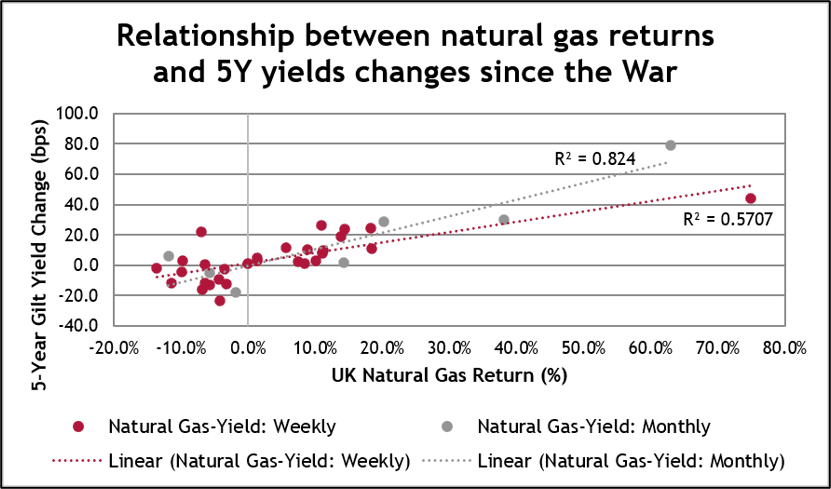
The final figure plots weekly and monthly gas price changes since the war against five-year yield changes. Its R² values mean gas alone explains 57% of weekly and 82% of monthly yield movements, with each 10% rise in gas typically adding 5-10 bps to yields.
Of course, many of the other factors discussed earlier, such as fiscal responsibility and the AI build-out, will still be affecting the market’s perceptions of UK government borrowing costs (usually in an unfavourable direction). All of this said, and somewhat unsurprisingly, it is likely that the biggest driver of elevated borrowing costs in recent months is elevated energy prices and the inflationary impact these are expected to have.
The implication for those trying to forecast borrowing costs is an uncomfortable one as, if energy prices increasingly set the direction of the gilt market, then a growing share of what moves it originates well beyond the domestic policymaker’s reach. Left with interest rates as their principal lever, they face a narrower set of genuine choices, and sharper trade-offs between inflation and growth.
Further still, Trump’s notoriously brash and mercurial style of governance does not reassure markets or reduce uncertainty, as forming a baseline view of the trajectory of oil prices has become quite difficult as the path to de-escalation is obscured. The corollary is that yields can fall just as quickly. Were a durable ceasefire to take hold and oil started to flow through the Strait again, a retreat in oil and gas prices would likely see gilts give back much of the premium built up since February.
This two-way risk goes a long way to explaining why the Bank of England, like many of its peers, initially chose to look through the shock. Monetary policy operates with a considerable lag, with the full effect of a rate change typically taking 18-24 months to feed through. Were the Bank to tighten sharply in response to an energy spike that then recedes, higher rates would affect an economy where the original inflationary pressure had already faded, deepening the hit to growth for little gain on inflation. The credibility-boosting monetary tightening becomes a potentially costly mistake, damaging the very credibility it was meant to bolster.
That idea changes if the inflationary shock were to embed itself. Should higher energy costs pass into wages, and wages back into prices, a self-reinforcing loop of second-round effects could force the Bank’s hand regardless of where oil goes next. We would caution against overstating this risk, however. With consumers under strain and the labour market loosening, workers have little bargaining power to win compensating pay rises; the conditions for a wage-price spiral look far weaker than in 2022. Even so, the path of Bank Rate, and of gilt yields with it, remains unusually contingent on events in the Middle East.
While the future path of geopolitical conflict, and inflation and interest rates by extension, is inherently unknowable and out of the hands of monetary policymakers, let alone individual treasury managers, we believe that informed economic forecasting paired with prudent treasury management can still deliver improved outcomes. For organisations planning to borrow, these swings can materially change the cost of new debt, and yields warrant close monitoring in the run-up to any issuance. If you would like to know more about our economic forecasting and treasury management services, including ongoing monitoring of borrowing costs, please contact fwatson@arlingclose.com.


-960x640.webp&w=3840&q=75)