The Cboe Volatility Index – better known by its ticker ‘VIX’, is a financial benchmark devised to act as a live market estimate of the expected volatility of the S&P 500 Index. VIX is calculated by using the midpoint of the real-time S&P 500 index (SPX) option bid/ask quotes, in the next 30 days. This index is typically a tool used to measure short-term investor sentiment, but also used as a foundation for active investing strategies, from portfolio hedging to directional speculation. Created in 1993 and maintained by the CBOE Options Exchange, this index holds importance in trading and investment, as it offers a quantifiable measure of market risk and investor sentiments.
The VIX is forward-looking and seeks to predict the variability of future market movements. This contrasts ‘actual’ volatility, which measures the variability of prices that we are aware of. The fact that the VIX represents historical volatility is important, as it is based on how much investors are willing to pay for the right to buy or sell a stock (call or put options).
Volatility is one of the main drivers of stock and index options’ prices and premiums. As the VIX is the most commonly monitored index of market volatility, it has an extensive impact on option prices/premiums. A higher VIX means higher prices for options and vice versa.
The higher the VIX, the higher the ‘fear’. A low VIX would indicate a more stable market. The price movements of the S&P 500 and the VIX often represent an inverse relationship: when the S&P falls sharply, the VIX rises—and vice versa.
This tool can be used to make more informed investment decisions. Usually, when the price of VIX is:
0-15: Indicates somewhat optimism in the market as well as very low volatility.
15-25: Indicates that there is a certain amount of volatility, though not necessarily extreme.
25-30: Indicates that there is market turbulence and volatility is increasing.
30+: Indicates that the market is experiencing heightened volatility and there may be some imminent shifts from increased uncertainty, risk, and investor fear.
These levels are expressed in percentage terms and relate to expected annualised volatility – a reading of 15 would imply an expected annualised volatility of 15% over the next 30 days.
The value of the index will rise with market uncertainty and higher expected volatility, corresponding with an overall increase in option prices. When investors expect upswings or downswings in stock prices, they often seek to reduce risk by using options to ‘hedge’ their positions. Hedging is a type of insurance, involving an investor taking an opposite position in a stock to protect them against potential losses in the original investment, through buying an option. The inverse relationship with the performance of the stock market can help identify investors behaviour towards buying options to hedge their positions, as when the price of options rises, so does the VIX.
In recent months we saw the VIX value drop to near pre-pandemic levels, tumbling to over 50% from its highest level this year. This is partly driven by the easing concerns of the US economy, notably investors trust that risky banks like PacWest will not follow the path of Credit Suisse and First Republic, which collapsed earlier this year. On the year, the VIX is lower by 35.8% and down 54.5% since it reached a 2023 peak on March 13th, during the peak of the US regional banking crisis.
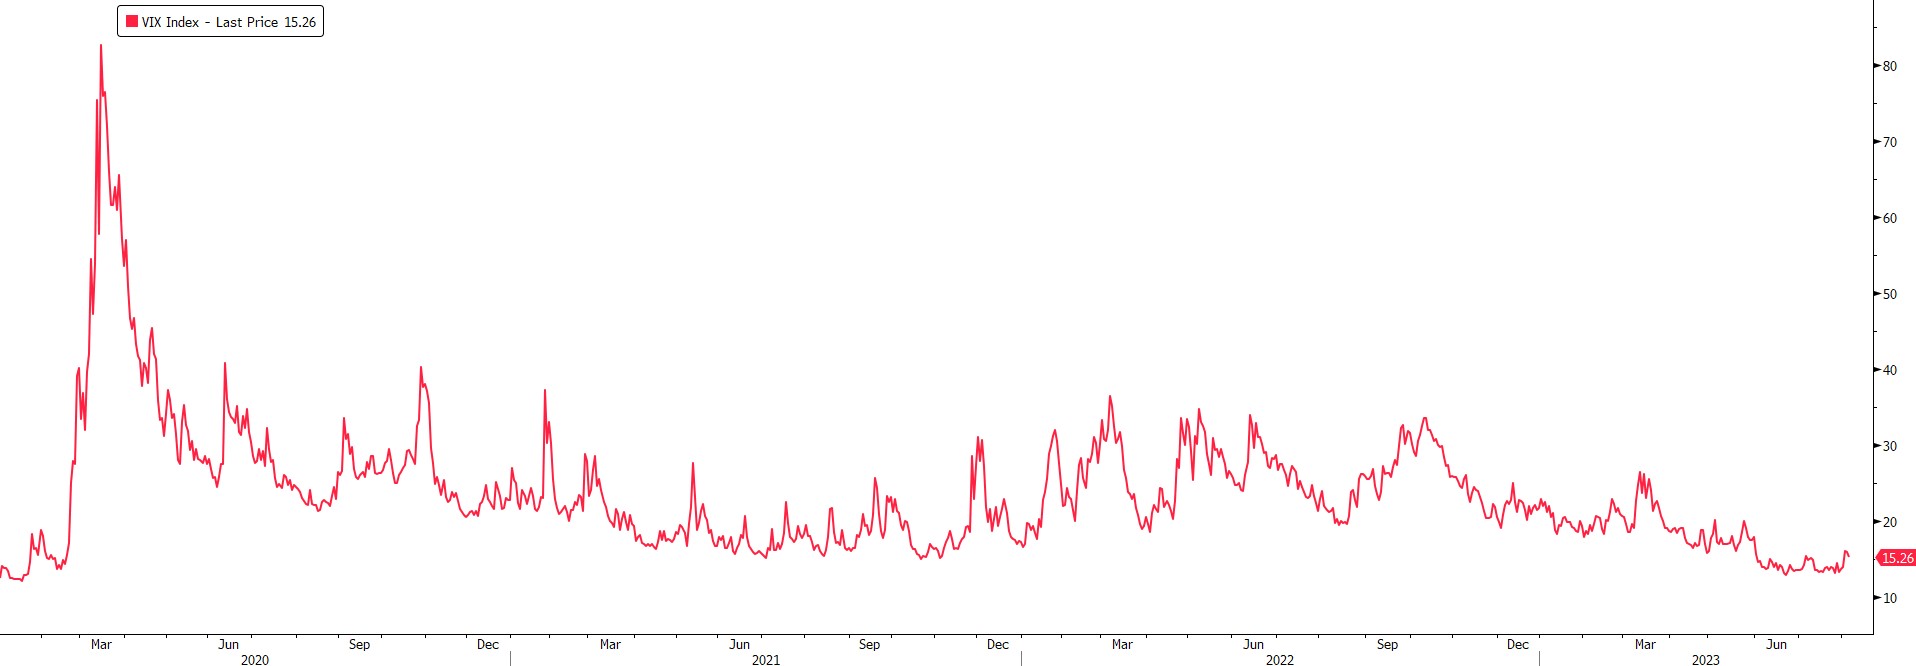
Source: Bloomberg
The VIX is influenced by a range of factors that collectively influence market sentiment and expectations for future volatility. The impact of these factors can vary over time and involves the likes of market uncertainty and fear during economic/geopolitical turmoil, the inverse relationship with stock market performance, implied volatility derived from option prices, economic data and events, interest rate changes, etc.
The overall reliability of this index will largely depend on its intended use and context, but it has proven to provide crucial insights to the market. While it is a key indicator of market sentiment, it doesn’t necessarily deliver accurate future predictions of market movements. It merely reflects the current market sentiment and expectations for the near term. Further, it is calculated based on historical data and implied volatility from options prices, which won’t precisely capture future market conditions. During turbulent market conditions, the VIX may also display behaviour that differs from historical trends. Investors should use the VIX in conjunction with other analysis and indicators for a more thorough judgment of market conditions as no single metric will predict the complexities of the financial markets.
Related Insights
What Happened to Silicon Valley Bank