Quantitative easing has been deployed to significant effect twice, firstly following the financial crisis and secondly during the pandemic. The two situations differed in that the first simply balanced the collapse in private sector monetary expansion, while the second supercharged its growth. Private sector demand through the pandemic was bolstered by expansionary fiscal policies, so QE was largely undertaken to shore up fading liquidity in financial markets. During a time when production was constrained, the expansion in money supply was therefore behind some of our inflationary woes and explains why central banks appear desperate to move to highly restrictive monetary policy.
From February 2020 to September 2022, outstanding UK M4, which is notes, coins, bank deposits, and money market debt instruments with a maturity up to 5 years, jumped from £2,530bn to £3,117bn. Compared to pre-pandemic trends, this suggested there was an additional £230bn of money in the economy over and above what we should expect. Much of this growth was seen between Feb 2020 and June 2020, when QE was restarted and lockdown was in force, preventing households from spending.
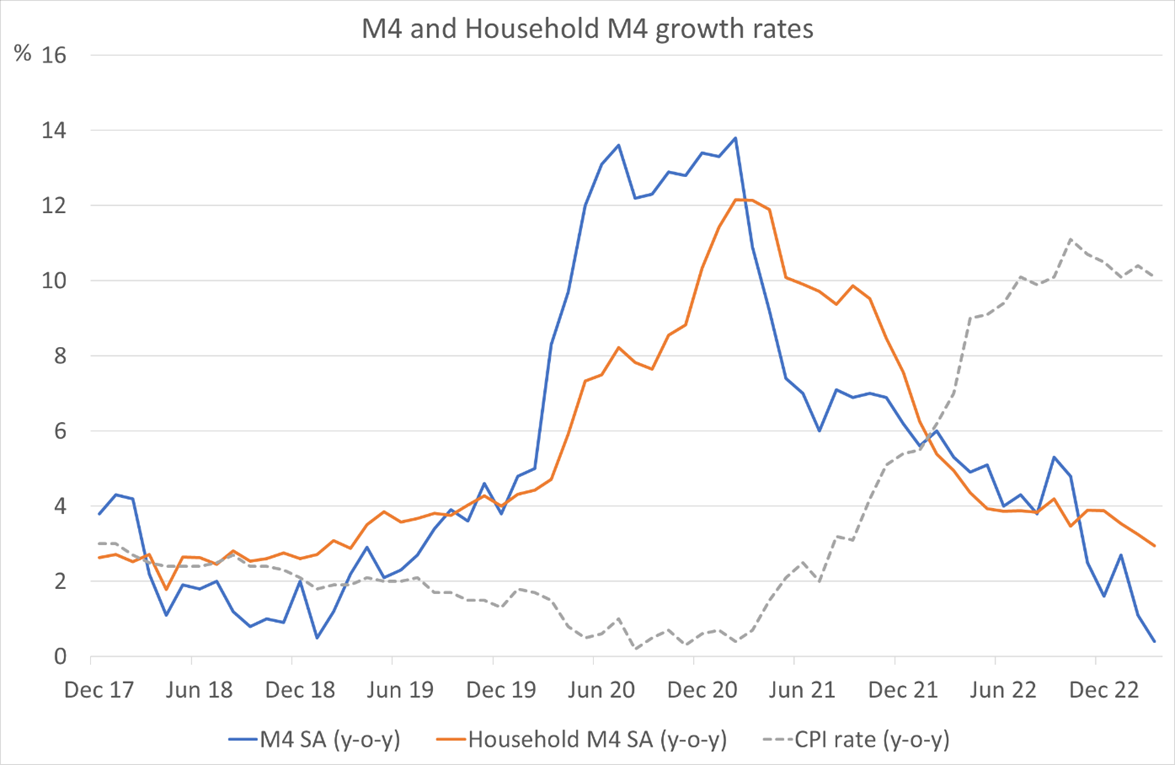
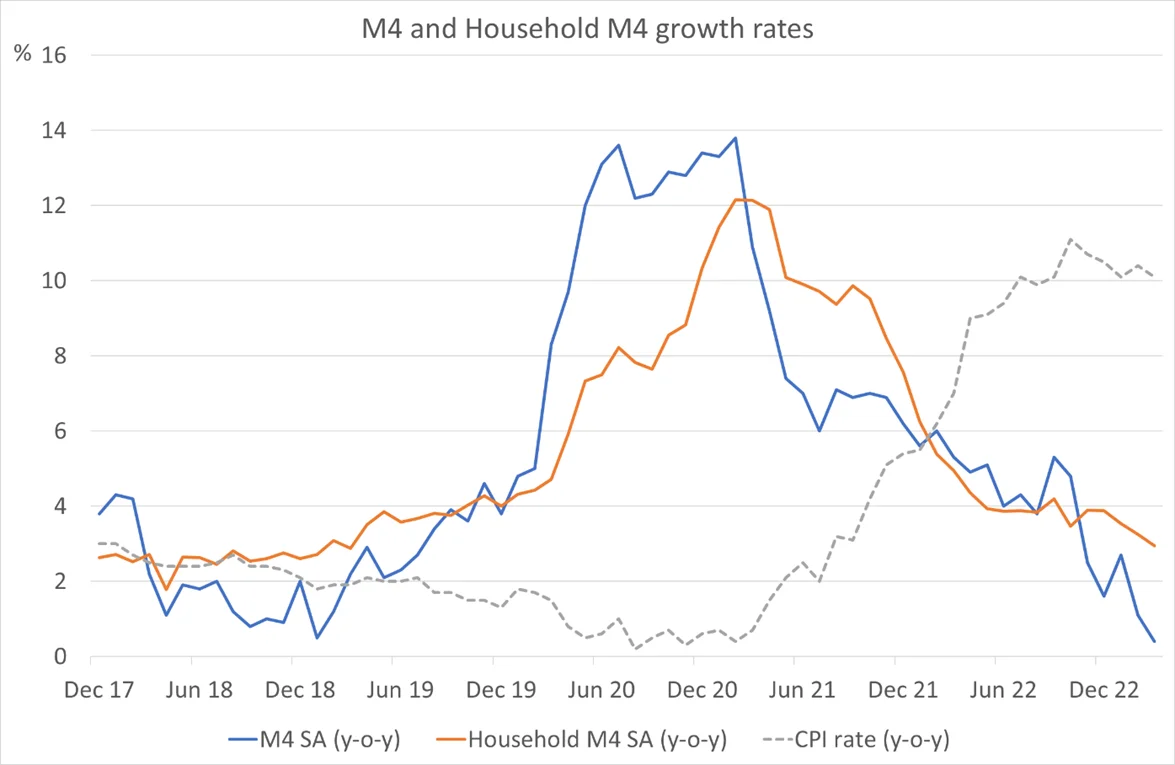
But what about when money growth starts to ease? This is indeed the case more recently; year-on-year growth in M4 in March 2023 was just 0.4%, down from growth rates of between 12% to 14% during 2020. Outstanding M4 has also declined since its peak in September 2022; the difference between M4 and “trend M4” is now just £78bn. This should be no surprise as the Bank of England is actively draining money from the economy through quantitative tightening (the Bank is reducing its bond holdings by £100bn in 2023, through natural maturities and sales) and has reduced demand for credit through higher interest rates (Bank Rate has risen by 440 basis points since December 2021).
Slowing M4 growth rates are also suggestive of erosion in household deposit balances. It is not difficult to envisage households drawing down deposit balances to maintain living standards in the face of rising prices, but, while household sector deposit balances did peak in December 2022, household M4 growth has remained more resilient than the overall M4 measure.
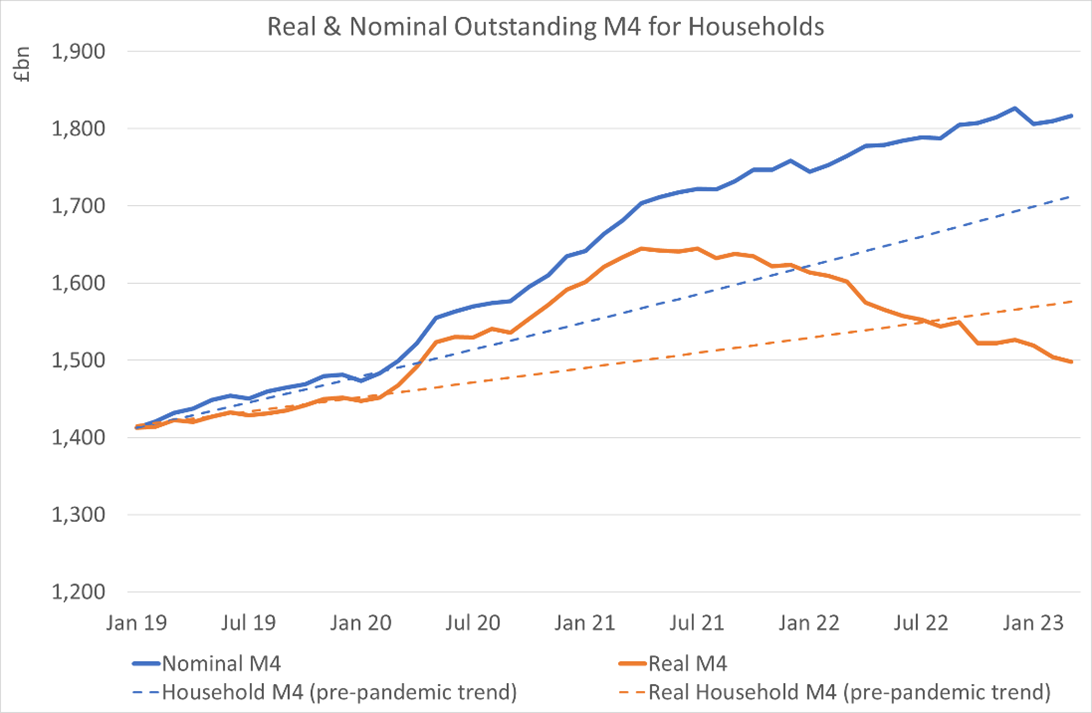
More interesting is the picture in real terms. The chart above includes the CPI rate, which is now significantly in excess of money growth rates. As the chart below shows, in real terms, M4 growth is now substantially negative, indicating real deterioration in depositor balances. You may have more cash in the bank account, but it could be worth far less.
What does this mean for inflation and growth?
In nominal terms, total M4 peaked in September 2022 and was 2.5% below this in March 2023. Declines or slow growth in M4 is normally associated with declines/slow growth in economic activity and inflation (see Fisher’s exchange equation), although pandemic build in deposit balances may muddy the water here. This relationship usually acts with a roughly 12-month lag (similar to changes in interest rates). This relationship can be seen on the chart below, with UK M4 growth and the 12-month forward RPI rates since the early 1980s. The current lag may be longer given the pandemic imbalances, but the sharp decline in money growth rates (potentially into negative rates in future months?) is unlikely not to have an effect.
Looking at the household sector, household M4, the stock of M4 money held by households, has plateaued. Household M4 peaked in December 2022 and appears more resilient than overall M4, being just 0.5% below the peak in March 2023. When adjusted for inflation, real household M4, however, has now fallen below the level associated with pre-pandemic trend growth.
If households had managed to stave off the UK recession in 2022 and early 2023 by dipping into stockpiled savings, this does not appear a viable option over the rest of 2023 due to the real deterioration in balances. Without savings, the onus will be on real disposable income growth to drive spending. As the costs of servicing mortgages and other debt rise, this suggests that households will struggle to support economic growth for the remainder of 2023, despite a likely decline in retail energy bills.
By aggressively increasing the price of credit and restricting its supply, the Bank of England is using lagging tools to depress current economic growth and inflation. While the current economic position is certainly better than we expected, the money data suggests that the downward pressure on inflation in the future may be greater than that expected just through base effects. Unfortunately, the lagged effects of higher interest rates and reducing money supply will only be felt later, which may mean policymakers are creating future problems to deal with the current one.
Related Insights